Find out what is an average Fargo rating is in pool.
According to Fargorate the average Fargo Rating for pool players is somewhere in the region of 455 to 500. The more players that enter the system the more the average should move to the left ie. move lower.
This is based on the assumption that most of the better players are playing competitively and are therefore already in the system. Plus there are many thousands of players all over the world that play to the low side of average on the bell curve, that do not have a rating
How good are you compared to others?
This seems like a strange question to ask, why would I ask you how good is your average game?
Why Do You Need To Know?
The reason is everybody talks about how good they can play on that one day a year when they play so good they could probably beat anybody in the world. That is not the way to judge your game unless you want to be flat broke.
In my area we have tournaments for under 550, under 600, under 650 and open. In the open competitions players often range from 450 to 750 rating with the majority of players around 600.
What Is Your Average Game?
Ninety-nine times out of a hundred you will be in a position where you will play somewhere in between your best game and you worst game. This means that most of the time you will be playing your average game.
So the question is…can you still win playing your average game?
Why Your “Best Game” is a Problem.
We could all win when we playing our best game but the problem is we tend to judge ourselves based on that rare occasion when we’re playing lights out. This is great for the ego but a very poor way of ranking your pool game.
In order to get a realistic assessment of your game you need to look at the matches you have played over the last few months or years and honestly ask yourself; did I play my best game every night, was I really struggling, was I playing my average game?
The reason I’m talking about this is because most people when assessing their game compare themselves to somebody else, maybe a better player. This may be not such a good plan.
When these people are watching a match they often say to themselves or their friendly rail birds “How is he in the final, I can play much better than him, I could give him the 8 ball?”
Average Versus Average.
The real way to look at a match up between you and somebody else is to ask yourself: if he plays his average game and I play my average game can I win? If the answer’s yes then you probably have a good game if the answer is no you should probably look elsewhere.
Yes you could play better than average and win, so could your opponent or you could play badly and get beaten by his average game. You will never know exactly how any given match will go until you play.
So why not get the odds in your favor?
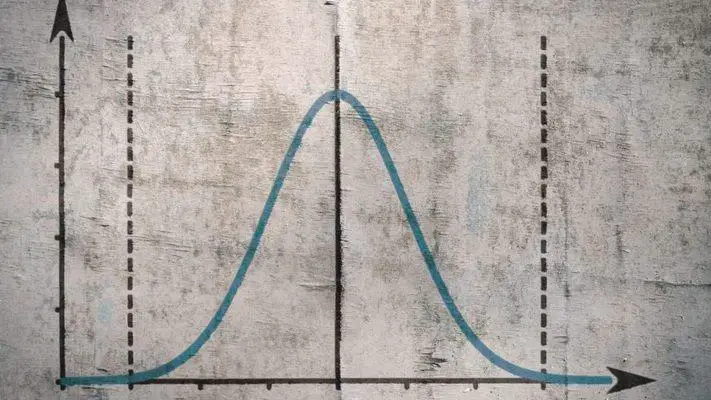
The bell curve.
The bell curve is a measure of the statistical probability of an event occurring. Normal distribution of those events gives rise to a bell shaped graphical representation, hence the name.
This isn’t a billiards bell curve, if it were then 68% of all players would be average or close to average performers with 16% playing one standard deviation better than average and 16% playing one standard deviation worse.
The extreme tails (0.1%) would contain either exceptionally poor or exceptionally gifted players.
Standard Deviation from the Mean.
Plus or minus one standard deviation from the mean in most bell curves will contain 68% or approximately 2/3 of all data. So in pool 68% of all players will be within one standard deviation from the mean. In other words most players are close to average or average.
What Does this Mean for Me and My Pool Game?
Your pool performance and hence your results will follow your own personal bell curve which will vary from player to player. The shape may vary depending on your consistency etc. But quite simply put your performance next year will be your average or close to your average 68% of the time. You will play better 16% and worse 16% of the time. The more games that you play the closer your play will be to normal distribution.